Every forex trader faces a fundamental choice: should you base trading decisions on price charts or economic data? The reality is that both technical and fundamental analysis offer distinct advantages, and understanding when to apply each approach separates profitable traders from those who struggle. Technical analysis focuses on price patterns, charts, and indicators to forecast short-term movements, while fundamental analysis examines economic indicators, central bank policies, and intrinsic value to identify longer-term trends. This article explains the core principles, essential tools, appropriate timeframes, and practical applications of each method. You’ll learn how professional traders combine both approaches to establish market direction with fundamentals and time precise entries with technical signals—a hybrid strategy that addresses the weaknesses inherent in relying on either method alone.
What Is Technical Analysis?

Technical analysis examines price charts, patterns, and trading volume to forecast where currency pairs will move next. Rather than evaluating economic reports or corporate earnings, technical traders believe the chart tells the complete story. Every political development, interest rate decision, and economic surprise already lives within the price action itself.
The Three Core Principles
Technical analysis rests on three foundational assumptions that separate it from other market approaches.
Price discounts everything. Current market prices already incorporate all available information—economic data, geopolitical tensions, central bank policies, and trader sentiment. When the European Central Bank announces a rate decision, the EUR/USD price instantly reflects that news along with market expectations about future policy. Technical analysts argue there’s no need to study the fundamentals separately because the chart captures everything that matters.
Price moves in trends. Markets don’t move randomly. They establish directional patterns that persist over time—uptrends, downtrends, and sideways ranges. Once a trend begins, it’s more likely to continue than reverse. This principle forms the basis for trend-following strategies that dominate technical trading approaches.
History repeats itself. Human psychology drives markets, and people react to fear and greed in predictable ways. Chart patterns like head-and-shoulders formations or double bottoms recur because traders respond similarly to comparable price situations. Candlestick patterns developed in 18th-century Japan still appear on modern forex charts because market psychology remains constant across centuries.
Why Traders Use Technical Analysis
Technical analysis appeals to traders seeking precise entry and exit points. A fundamental analyst might determine the dollar is overvalued, but technical tools pinpoint exactly where to place a trade at 1.0850 with a stop-loss at 1.0920. This precision proves especially valuable in the $7.5 trillion daily forex market where timing determines profitability.
What Is Fundamental Analysis?

Fundamental analysis evaluates currencies by examining the underlying economic, financial, and political forces that drive their value. Unlike technical traders who study price charts, fundamental analysts act as economic detectives, piecing together macroeconomic data to forecast which currencies will strengthen or weaken over months or years.
In forex markets, this approach centers on national economic health and monetary policy. A fundamental trader doesn’t just watch EUR/USD move on a screen—they analyze why Germany’s manufacturing output matters, how European Central Bank rate decisions shift capital flows, and whether U.S. employment data signals dollar strength.
Key Economic Indicators for Forex
Fundamental forex traders monitor several critical data releases that move currency pairs:
- Gross Domestic Product (GDP): Measures total economic output and growth trajectory
- Employment reports: Non-farm payrolls, unemployment rates, and wage growth signal economic strength
- Inflation data: Consumer Price Index (CPI) and Producer Price Index (PPI) influence central bank decisions
- Trade balances: Import/export ratios affect currency supply and demand
- Retail sales and consumer confidence: Indicate spending power and economic momentum
These indicators reveal whether an economy is expanding or contracting, which directly impacts currency demand. Strong GDP growth typically strengthens a currency as investors seek higher returns in that economy.
The Role of Central Bank Policy
Central banks wield enormous influence over currency values through interest rate decisions and monetary policy statements. When the Federal Reserve raises rates, the dollar often appreciates as higher yields attract foreign capital. Conversely, quantitative easing programs that increase money supply typically weaken currencies.
Fundamental traders scrutinize central bank meeting minutes, forward guidance, and policymaker speeches to anticipate policy shifts. The goal: identify currencies likely to appreciate based on economic fundamentals rather than short-term price patterns. This approach requires patience, as fundamental trends unfold over weeks or months rather than hours.
Core Technical Analysis Tools and Indicators

Technical traders rely on a specific toolkit to identify trading opportunities and time their entries and exits. These tools fall into two primary categories: visual chart patterns and quantitative indicators that measure price momentum, trend strength, and potential reversals.
Chart Patterns
Chart patterns represent recurring formations that traders believe signal continuation or reversal of existing trends. These visual structures emerge from collective market psychology as buyers and sellers interact at different price levels.
Common reversal patterns:
- Head and shoulders: Three peaks where the middle peak exceeds the outer two, signaling trend exhaustion
- Double tops and bottoms: Two failed attempts to break through a price level
- Triangles: Converging trendlines that indicate consolidation before a breakout
Continuation patterns:
- Flags: Brief rectangular consolidations that slope against the prevailing trend
- Pennants: Short-term triangular formations following sharp price movements
- Rectangles: Horizontal trading ranges between clear support and resistance
Technical Indicators
Mathematical calculations applied to price and volume data provide objective signals that remove emotional bias. These indicators quantify what chart patterns show visually.
Momentum oscillators:
- RSI (Relative Strength Index): Measures speed and magnitude of price changes on a 0-100 scale, with readings above 70 indicating overbought conditions and below 30 signaling oversold
- Stochastic: Compares closing price to recent price range over a specified period
- MACD (Moving Average Convergence Divergence): Shows relationship between two moving averages to identify momentum shifts
Trend indicators:
- Moving averages: Smooth price data to identify direction, with 50-day and 200-day periods commonly watched
- Bollinger Bands: Display volatility boundaries around a moving average
- ADX (Average Directional Index): Quantifies trend strength regardless of direction
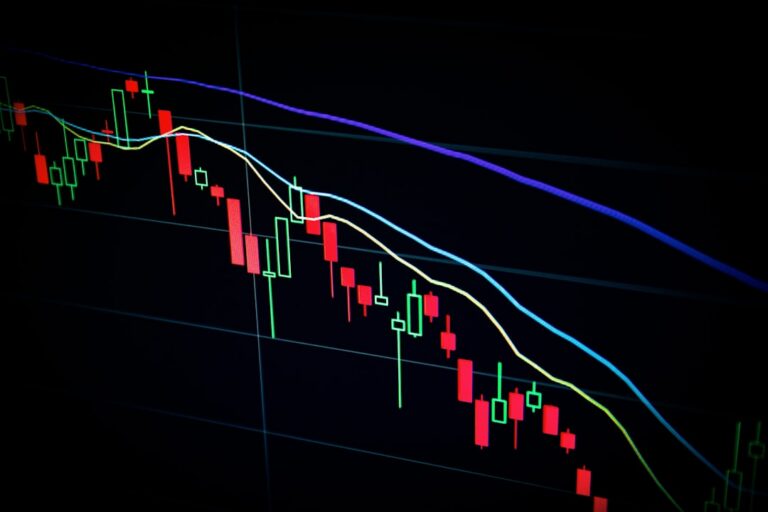
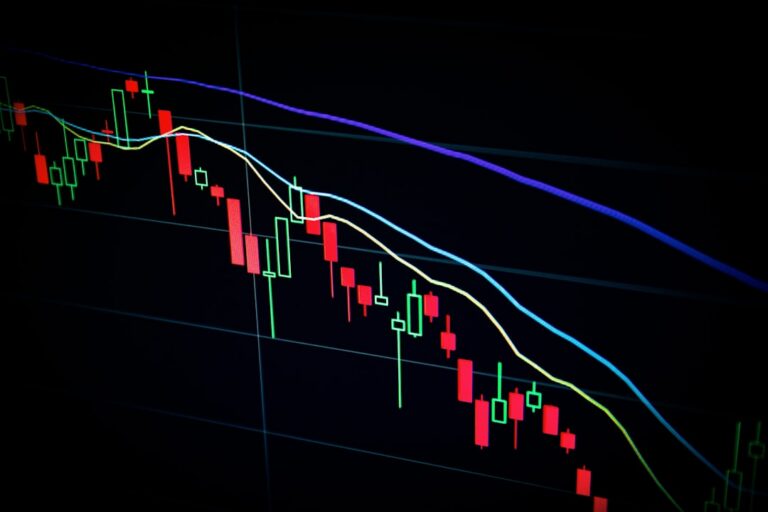
Candlestick patterns, developed by 18th-century Japanese rice traders, add another dimension by showing opening, closing, high, and low prices in single visual elements. Patterns like doji, hammer, and engulfing candles signal potential reversals or continuation.
Support and resistance levels often become self-fulfilling prophecies. When large numbers of traders watch the same price levels and place orders accordingly, these levels gain significance purely through collective attention rather than fundamental value changes.
Key Differences: Technical vs Fundamental Analysis

Traders choosing between technical and fundamental analysis face distinct methodological differences that extend far beyond simple chart reading versus news monitoring. These approaches differ fundamentally in their data sources, time horizons, and practical applications in live markets.
| Dimension | Technical Analysis | Fundamental Analysis |
|---|---|---|
| Primary Data Source | Price charts, volume, historical patterns | Economic reports, GDP, interest rates, central bank policy |
| Time Horizon | Minutes to weeks (short-term focus) | Weeks to years (long-term focus) |
| Core Assumption | All information is reflected in price | Markets can misprice assets relative to intrinsic value |
| Ideal Trader Profile | Day traders, scalpers, swing traders | Position traders, investors, long-term strategists |
| Entry/Exit Timing | Precise entry and exit points using indicators | Broader directional bias with less precise timing |
| Key Tools | Moving averages, RSI, MACD, candlestick patterns | Employment data, inflation reports, geopolitical analysis |
| Market Efficiency View | Follows Efficient Market Hypothesis principles | Believes markets can remain mispriced temporarily |
Technical analysts rely on observable price action, using tools like the Relative Strength Index or head-and-shoulders patterns to identify trading opportunities within hours or days. A EUR/USD trader using technical analysis might spot a double-bottom formation and enter a long position when price breaks above the neckline, setting a tight stop-loss based on recent support levels.
Fundamental analysts examine macroeconomic conditions to determine whether a currency is overvalued or undervalued. When the European Central Bank signals interest rate hikes while U.S. rates remain stable, fundamental traders anticipate euro strength over months, less concerned with daily price fluctuations.
The forex market’s $7.5 trillion daily volume creates opportunities for both approaches. Technical analysis excels in liquid, trending markets where patterns repeat with statistical reliability. Fundamental analysis proves valuable during major economic shifts—central bank policy changes, employment surprises, or geopolitical events—that create sustained directional moves lasting weeks or months.
Neither approach guarantees profitability. Many successful traders combine both methodologies, using fundamental analysis for directional bias and technical analysis for execution timing.
Trading Timeframes and Which Analysis Fits Best
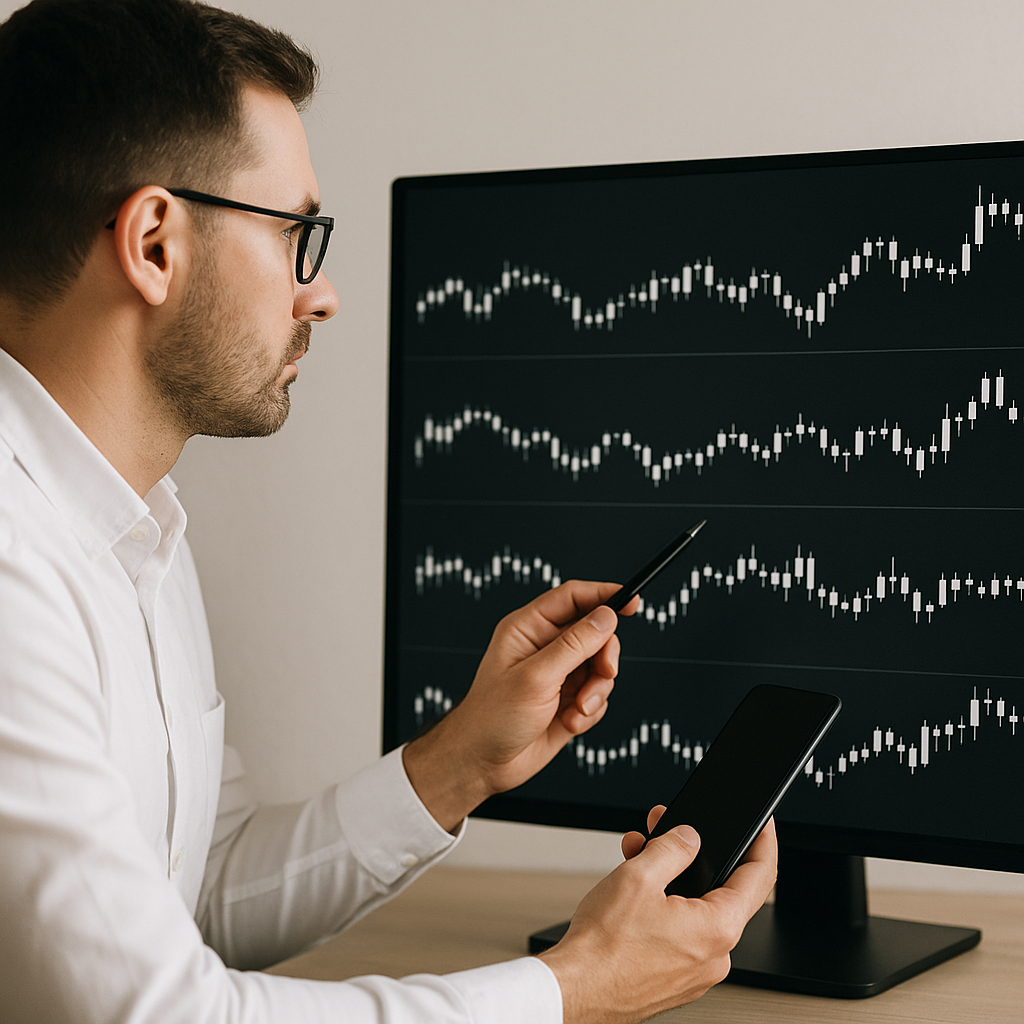
Your trading timeframe fundamentally determines which analytical approach delivers the most actionable insights. Scalpers executing trades within seconds or minutes cannot wait for quarterly GDP reports, while position traders holding for months need more than a crossover on the 5-minute chart.
Short-Term Trading (Scalping and Day Trading)
Scalpers and day traders operate in a technical analysis environment almost exclusively. When you’re opening and closing positions within minutes or hours, price action patterns, support and resistance levels, and momentum indicators provide the immediate signals you need. A scalper watching the EUR/USD on a 1-minute chart relies on precise entry points identified through candlestick formations or RSI divergence, not central bank policy statements.
Day traders typically monitor multiple timeframes—checking the daily chart for overall trend direction, then dropping to 15-minute or 5-minute charts for specific entries. Volume spikes, moving average crossovers, and Fibonacci retracement levels guide these decisions. Fundamental news releases like Non-Farm Payrolls create volatility opportunities, but even here, traders watch how price reacts rather than calculating fair value.
Medium to Long-Term Trading (Swing and Position)
Swing traders holding positions for days or weeks benefit from combining both approaches. Fundamental analysis identifies which currency pairs have directional bias—perhaps the Federal Reserve’s hawkish stance supports USD strength—while technical analysis pinpoints optimal entry zones when price pulls back to a key moving average.
Position traders maintaining trades for months prioritize fundamental analysis to establish market direction, then use technical analysis for precise timing. If economic indicators suggest the Australian dollar should strengthen against the yen over six months, technical analysis helps avoid entering just before a short-term correction. Monthly and weekly charts reveal major support zones where fundamentally sound positions offer better risk-reward ratios.
How Professional Traders Combine Both Approaches

Most professional traders reject the false choice between technical and fundamental analysis. Instead, they use fundamental analysis to identify market direction and technical analysis to time precise entries and exits. This hybrid approach capitalizes on the strengths of both methods while compensating for their individual weaknesses.
The Hybrid Trading Workflow
Successful traders typically follow a structured process that integrates both analytical frameworks:
- Establish fundamental bias – Review economic indicators, central bank policies, and macroeconomic trends to determine whether to favor long or short positions in a currency pair
- Identify technical levels – Map key support and resistance zones, trend lines, and chart patterns where price action may validate or contradict the fundamental thesis
- Time the entry – Wait for technical confirmation signals such as candlestick patterns, moving average crossovers, or momentum indicator readings before entering trades
- Set risk parameters – Place stop-losses at technical invalidation points rather than arbitrary pip distances
- Monitor and adjust – Track both technical price action and incoming economic data to manage position size and exit timing
Algorithmic trading systems, which account for approximately 70% of forex market volume, predominantly rely on technical patterns for execution speed. However, many incorporate fundamental filters to avoid trading during high-volatility events or against strong macroeconomic trends.
Managing High-Impact News Events
Economic calendar monitoring forms a critical bridge between both approaches. High-impact events—including non-farm payrolls, central bank rate decisions, and GDP releases—frequently trigger 100+ pip volatility within minutes. Professional traders adjust their strategy around these releases:
- Pre-event positioning: Use technical analysis to identify favorable entry points aligned with fundamental expectations
- Event avoidance: Close positions or tighten stops before major announcements to prevent slippage and gap risk
- Post-event opportunities: Wait for initial volatility to settle, then use technical patterns to trade the new price direction established by fundamental data
This integrated workflow allows traders to capture broad market moves while avoiding the poor entry timing and excessive drawdowns that plague single-method approaches.
Limitations and Risks of Each Approach

Both analytical methods carry significant drawbacks that contribute to the sobering statistic that 80-90% of retail traders lose money. Understanding these limitations is essential for realistic expectations and proper risk management.
Technical Analysis Limitations
Technical indicators typically achieve only 50-60% predictive accuracy under normal market conditions. This barely-better-than-chance performance means that even skilled technical traders face frequent losses. The approach becomes particularly unreliable during major fundamental events—a perfectly formed chart pattern can disintegrate within seconds when a central bank announces an unexpected rate decision or geopolitical crisis erupts.
Technical analysis also suffers from the self-fulfilling prophecy problem. When thousands of traders watch the same support level or moving average, mass reactions create volatility that validates or invalidates signals based on crowd behavior rather than genuine market dynamics. Additionally, backtested strategies often fail in live trading because past price patterns don’t guarantee future repetition, especially as market structure and participant behavior evolve.
The lag inherent in most indicators creates another challenge. By the time moving averages confirm a trend or oscillators signal overbought conditions, substantial price movement has already occurred. Traders frequently enter positions too late or exit prematurely based on delayed signals.
Fundamental Analysis Limitations
Fundamental analysis provides no guidance on precise entry and exit timing. A currency may be fundamentally undervalued for months or years before price reflects that reality. Traders with correct fundamental assessments can still suffer significant drawdowns or margin calls while waiting for the market to align with their thesis.
Economic data interpretation is subjective and often contradictory. Strong employment numbers might strengthen a currency or weaken it if markets interpret the data as reducing stimulus likelihood. Neither approach eliminates trading risk or guarantees profitability, regardless of sophistication or experience level.
The debate between technical and fundamental analysis presents a false dichotomy. Neither approach is inherently superior—each serves different purposes and trading timeframes. The most effective traders use fundamental analysis to understand broader market context and directional bias, then apply technical analysis to execute trades with precise entry and exit timing. This combination addresses the core weakness of each method: fundamentals identify what to trade, technicals determine when to trade it.
The $7.5 trillion daily forex market offers substantial opportunities, but success requires disciplined analysis, rigorous risk management, and realistic expectations about both winning percentages and drawdown periods. Start by mastering one analytical approach that aligns with your preferred trading timeframe—technical tools for short-term trading, fundamental analysis for position trading. As you gain experience and develop consistent execution habits, gradually incorporate elements of the complementary approach. Track which economic indicators move your preferred currency pairs, or identify which technical levels consistently hold during fundamental trends. This incremental integration builds a more complete analytical framework without overwhelming your decision-making process.