Bollinger Bands are a volatility measurement tool developed by technical analyst John Bollinger in the early 1980s. They measure market volatility and identify price extremes relative to recent trading ranges through a three-component structure: a middle moving average flanked by upper and lower bands set at two standard deviations. This statistical framework creates a dynamic envelope that expands during volatile periods and contracts during calm markets. Widely used by forex traders and technical analysts across all asset classes, Bollinger Bands provide objective readings of price extremes and volatility cycles. This article explains their construction, what they actually measure, how to interpret key patterns, and why they work best when combined with complementary indicators—without promising guaranteed trading outcomes.
The Structure of Bollinger Bands
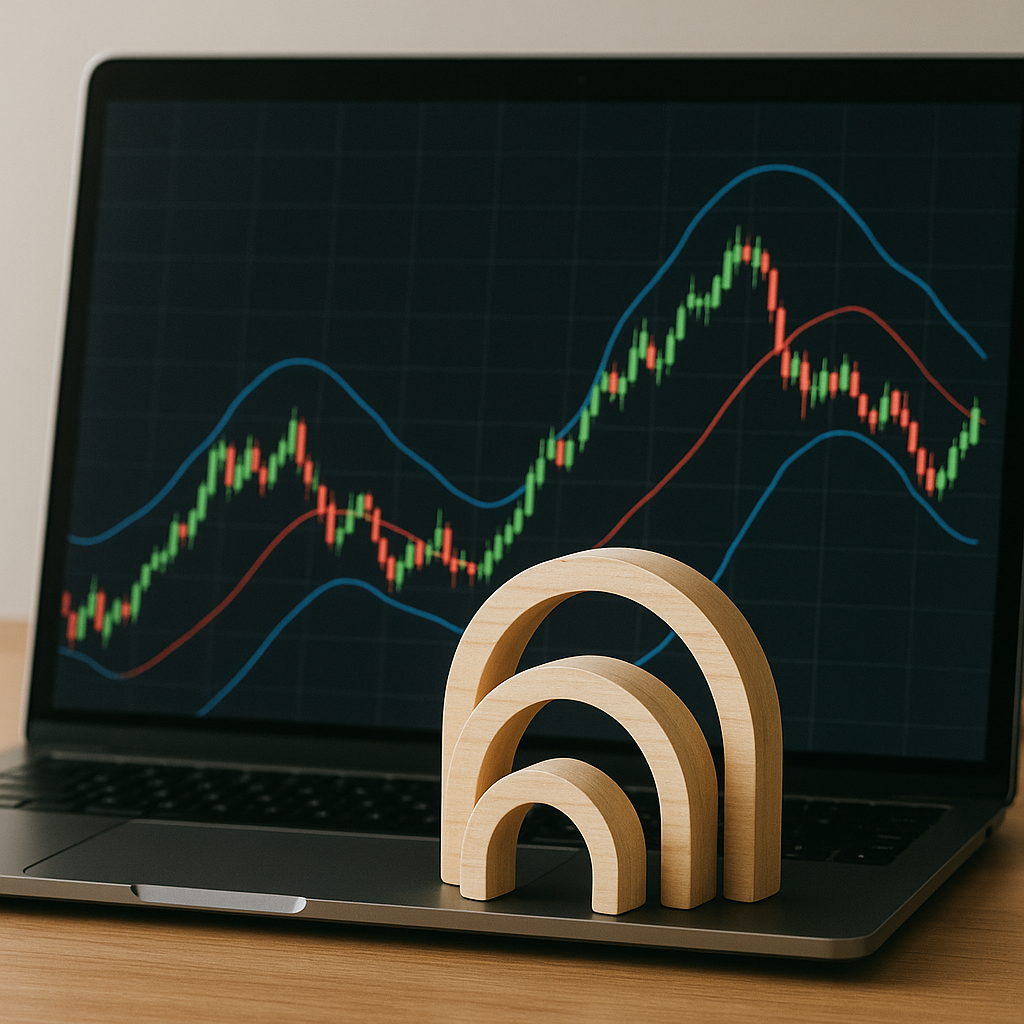
Bollinger Bands consist of three distinct lines that work together to create a dynamic envelope around price action. This three-component system adapts automatically to changing market conditions, expanding and contracting based on volatility levels.
The Middle Band: Simple Moving Average
The middle band serves as the indicator’s foundation and is calculated as a simple moving average (SMA). The default setting uses a 20-period SMA, which represents approximately one month of trading data on daily charts. This moving average smooths out short-term price fluctuations and establishes a baseline trend reference. Traders can adjust this period to suit different trading styles—shorter periods like 10 make the bands more responsive to price changes, while longer periods like 50 create smoother, less reactive bands.
Upper and Lower Bands: Standard Deviation Explained
The upper and lower bands are positioned at two standard deviations above and below the middle band. Standard deviation is a statistical measure that quantifies how much price data disperses from the average. In financial markets, it serves as a volatility gauge—higher standard deviation indicates greater price variability.
The two-standard-deviation setting has mathematical significance. According to probability theory, two standard deviations encompass approximately 95% of price data in a normal distribution. In practice, roughly 90% of price action occurs between the upper and lower Bollinger Bands under normal market conditions.
When volatility increases, the bands widen automatically as standard deviation rises. During calm markets, the bands contract as price movements become less erratic. This adaptive quality makes Bollinger Bands particularly useful for identifying volatility cycles. The default multiplier of 2.0 can be adjusted—conservative traders might use 2.5 or 3.0 for wider bands, while aggressive traders might use 1.5 for tighter bands that react more quickly to price movements.
What Bollinger Bands Measure

Bollinger Bands quantify market volatility and identify price extremes relative to recent trading ranges. Rather than measuring absolute price levels, these bands adapt continuously to changing market conditions through statistical calculation, making them a dynamic volatility gauge that adjusts automatically as markets become more or less turbulent.
Measuring Volatility Dynamically
The core measurement mechanism relies on standard deviation, a statistical concept that calculates how far prices typically stray from their average. When markets experience heightened volatility—such as during economic announcements or geopolitical events—the bands expand outward from the central moving average. Conversely, during quiet trading periods with narrow price ranges, the bands contract inward. This responsive behavior creates what traders call the “Bollinger Band squeeze,” a narrowing pattern that often precedes significant price breakouts.
The standard configuration uses two standard deviations from the middle band. This mathematical choice isn’t arbitrary. Two standard deviations create bands wide enough to capture most normal price movement without being so loose that they lose practical utility for identifying extremes.
Statistical Probability and Price Containment
Under normal market conditions, approximately 90% of price action occurs between the upper and lower bands. This containment rate stems from the statistical properties of the two-standard-deviation calculation, which theoretically encompasses roughly 95% of data points in a normal distribution.
When prices touch or breach the outer bands, they’ve reached statistical extremes relative to recent trading behavior. These touches don’t guarantee reversals—trending markets frequently walk along one band—but they signal that prices have moved significantly beyond their recent average range. Understanding that the bands measure relative volatility rather than absolute price targets helps traders avoid the common misconception that band touches automatically signal buying or selling opportunities.
Key Bollinger Band Patterns and Signals

Traders monitor specific Bollinger Band configurations to anticipate market movements and identify trade opportunities. These patterns reflect changes in volatility and momentum that often precede significant price action.
The Bollinger Squeeze
The squeeze represents one of the most reliable setups in technical analysis. When the bands contract to unusually narrow levels, volatility has compressed to a point where a sharp directional move typically follows. During a squeeze, the distance between the upper and lower bands shrinks as the market consolidates, signaling that traders should prepare for a breakout. The direction of the eventual move cannot be predicted by the squeeze alone—traders need additional confirmation from volume patterns, candlestick formations, or momentum indicators to determine whether the breakout will move up or down.
Walking the Bands During Trends
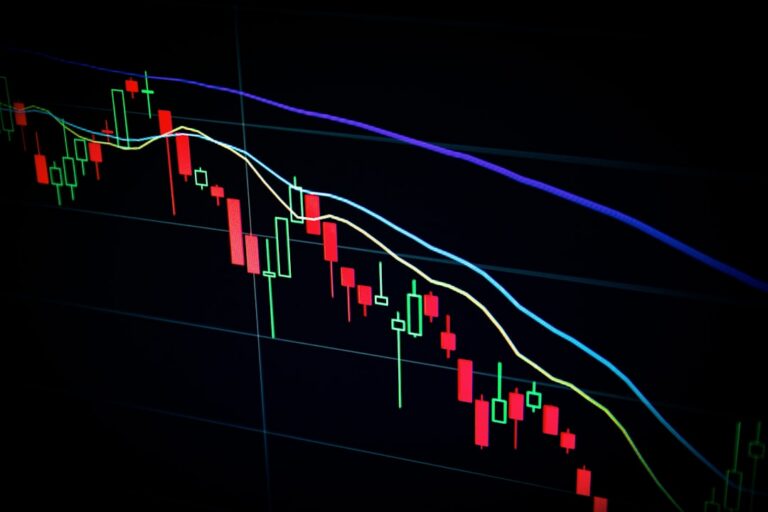
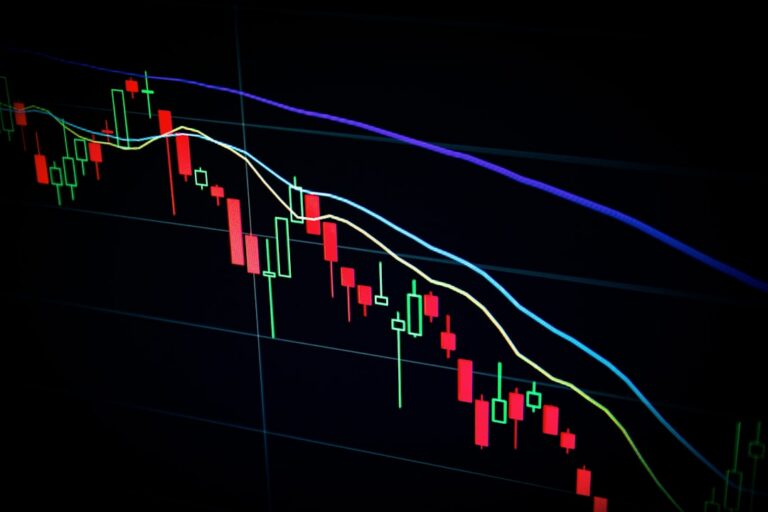
In strong trending markets, prices often “walk the band” by repeatedly touching or hugging the outer band without reversing. During an uptrend, prices may touch the upper band multiple times while the middle band (20-period SMA) acts as support. This pattern indicates persistent buying pressure rather than an overbought condition requiring immediate reversal. The opposite occurs in downtrends, where prices repeatedly contact the lower band.
Key pattern signals include:
- Band touches as continuation signals – When price reaches an outer band during a strong trend with expanding band width, it often signals continuation rather than reversal
- Overbought and oversold extremes – Price reaching the outer bands in range-bound markets may indicate potential reversal zones, though this should not be used as a standalone entry signal
- Middle band crossovers – Price crossing above or below the middle band (20-period SMA) can confirm trend direction changes
- Band width expansion – Widening bands following a squeeze confirm increased volatility and validate the breakout move
Traders should recognize that band touches alone do not guarantee reversals. Context matters—trend strength, volume, and overall market structure determine whether outer band contact represents exhaustion or continuation.
Bollinger Band Derivatives: %B and BandWidth

While Bollinger Bands provide visual cues about price position and volatility, two derivative indicators transform these visual relationships into precise numerical values. These derivatives eliminate subjective interpretation and enable traders to build systematic strategies around band dynamics.
Understanding %B
The %B indicator quantifies exactly where price sits relative to the bands on a scale where the upper band equals 1 and the lower band equals 0. A %B reading of 0.5 means price is at the middle band, while a reading of 1.0 indicates price is touching the upper band. Values above 1 show price has broken above the upper band, while readings below 0 mean price has breached the lower band.
This numerical precision helps traders identify extreme conditions objectively. For example, a %B reading of 1.2 indicates price is 20% of the band width above the upper band—a quantifiable overbought condition that might signal a potential reversal or consolidation. Similarly, a %B of -0.15 shows price has extended 15% below the lower band, potentially marking an oversold extreme.
Using BandWidth to Measure Volatility
BandWidth measures the percentage difference between the upper and lower bands, providing a direct volatility gauge. The formula divides the distance between bands by the middle band value, expressing volatility as a percentage of price.
Low BandWidth readings identify squeeze conditions objectively—periods when volatility has contracted and the bands have narrowed significantly. These squeezes often precede substantial price moves, making BandWidth a valuable tool for anticipating breakouts. A BandWidth reading at multi-month lows signals compressed volatility, while expanding BandWidth confirms increasing market activity and potential trend development.
Applying Bollinger Bands Across Markets and Timeframes

Bollinger Bands rank among the top five most widely used technical indicators by forex traders, but their utility extends far beyond currency pairs. This versatile tool adapts seamlessly to virtually any tradable instrument with sufficient price history and liquidity.
Market Applications
The indicator functions effectively across diverse asset classes:
- Forex pairs: EUR/USD, GBP/JPY, and other major and minor currency pairs
- Stocks: Individual equities and index ETFs on any exchange
- Commodities: Gold, crude oil, natural gas, and agricultural futures
- Cryptocurrencies: Bitcoin, Ethereum, and altcoins on major exchanges
The statistical foundation of Bollinger Bands—measuring price deviation from a moving average—translates consistently across these markets because volatility patterns emerge wherever supply meets demand.
Timeframe Flexibility
Traders customize Bollinger Bands to match their trading style by adjusting the chart timeframe:
- Day traders commonly use 1-minute, 5-minute, or 15-minute charts with the standard 20-period setting, capturing intraday volatility shifts
- Swing traders prefer 4-hour or daily charts to filter market noise and identify multi-day trends
- Position traders analyze weekly or monthly charts, where the 20-period moving average represents extended market cycles
Shorter periods make the bands more reactive to price movements, generating more signals but also more false alerts. Longer timeframes smooth volatility readings, producing fewer but potentially more reliable signals. A day trader might spot multiple squeeze-and-expansion cycles in a single session, while a position trader waits weeks for comparable setups.
This adaptability across markets and timeframes explains why Bollinger Bands remain a foundational tool in both algorithmic trading systems and discretionary analysis.
Combining Bollinger Bands with Other Indicators

John Bollinger himself advises traders never to rely on Bollinger Bands alone. The creator of this volatility tool emphasizes that bands measure price volatility and relative price levels, but they don’t confirm momentum, trend strength, or whether a reversal will actually occur. Over 70% of professional traders pair Bollinger Bands with complementary indicators to filter false signals and improve trade accuracy.
When price touches the upper or lower band, it signals potential overbought or oversold conditions—but not every touch leads to a reversal. This is where confirmation from momentum oscillators and trend indicators becomes critical. The most effective combinations help traders distinguish between genuine reversals and temporary pullbacks within strong trends.
Bollinger Bands + RSI
The Relative Strength Index (RSI) provides the momentum confirmation that Bollinger Bands lack. When price touches the lower band and RSI simultaneously shows readings below 30, the oversold signal carries more weight. Conversely, price at the upper band combined with RSI above 70 strengthens overbought signals.
This pairing works particularly well in ranging markets. If price reaches the lower band but RSI remains above 40, it suggests the downward move lacks conviction and a bounce may be premature. The RSI helps traders avoid entering counter-trend positions during strong directional moves where price repeatedly “walks the band.”
Bollinger Bands + MACD
The Moving Average Convergence Divergence (MACD) confirms trend direction and momentum shifts. When price breaks above the middle band (the 20-period moving average) and MACD crosses above its signal line, it confirms bullish momentum. This combination filters out false breakouts where price briefly crosses the middle band but lacks follow-through.
MACD divergence adds another layer of analysis. If price makes new highs at the upper band but MACD forms lower highs, it signals weakening momentum despite the band touch—often preceding reversals. This multi-indicator approach significantly reduces the risk of acting on isolated Bollinger Band signals without broader market context.
Limitations and Risk Considerations

Bollinger Bands, despite their widespread adoption, carry inherent limitations that traders must recognize before incorporating them into trading strategies. These constraints stem from the indicator’s mathematical foundation and the unpredictable nature of financial markets.
Common Misinterpretations
Price touching or piercing a Bollinger Band does not automatically signal a reversal. Many novice traders mistakenly interpret upper band contact as an immediate sell signal and lower band contact as a buy signal. Markets in strong uptrends frequently “walk the band,” with prices repeatedly touching or exceeding the upper boundary for extended periods without reversing. The same phenomenon occurs in downtrends along the lower band.
Structural Limitations
- Lagging nature: Bollinger Bands rely on historical price data through the simple moving average component, meaning they respond to market movements rather than predict them
- Statistical assumptions: The two-standard-deviation calculation assumes price data follows a normal distribution, which financial markets often violate during extreme events
- No directional bias: Bands measure volatility and relative price levels but provide no inherent indication of future price direction
- False signals: Band squeezes can persist longer than expected, and breakouts following squeezes may fail or reverse quickly
Risk Realities
Markets can remain in statistically abnormal conditions far longer than models suggest. The 90% probability that prices stay within the bands becomes meaningless during black swan events or sustained trending markets. No technical indicator, including Bollinger Bands, guarantees profitable trades or eliminates market risk.
Successful application requires combining Bollinger Bands with complementary indicators, fundamental analysis, and robust risk management protocols. Traders should never rely on band signals alone for entry or exit decisions.
Conclusion

Bollinger Bands offer a statistically-grounded approach to measuring market volatility and identifying price extremes across all markets and timeframes. Their three-component structure—a simple moving average flanked by bands set at two standard deviations—creates an adaptive framework that expands and contracts with changing market conditions. Understanding what Bollinger Bands actually measure is fundamental to using them effectively: they quantify volatility and relative price position, not directional bias or guaranteed reversal points.
The indicator’s true value emerges when combined with complementary tools. Pairing Bollinger Bands with momentum oscillators like RSI or trend confirmation tools like MACD helps filter false signals and improves decision quality. Derivative indicators such as %B and BandWidth add numerical precision to visual patterns, enabling systematic approaches to volatility analysis.
As you incorporate Bollinger Bands into your analysis, remember that no technical tool eliminates market risk. Band touches don’t guarantee reversals, squeezes don’t predict breakout direction, and statistical probabilities break down during extreme market events. Use Bollinger Bands as part of a comprehensive trading approach that includes proper risk management, multiple confirmation signals, and realistic expectations about what technical indicators can and cannot deliver.