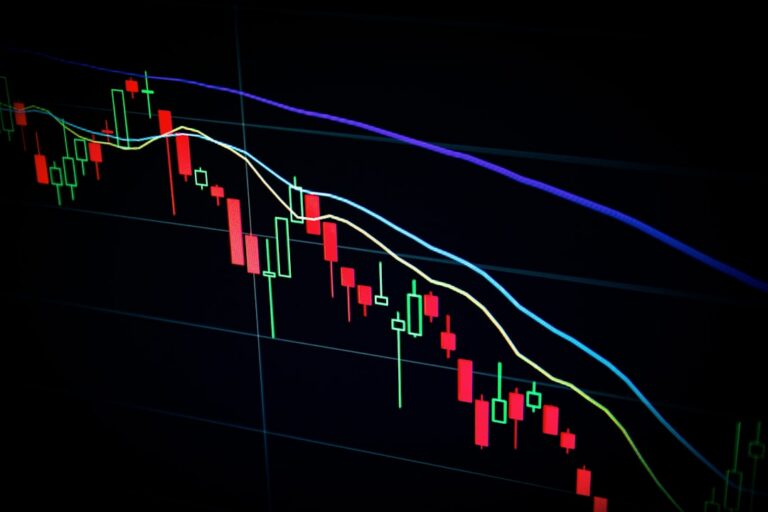
Moving averages smooth chaotic price fluctuations into a single line that reveals the underlying trend—a function that explains why 60-70% of professional traders incorporate them into their analysis. These indicators calculate the average closing price over a specified period, filtering out random market noise to show whether a currency pair is trending up, down, or moving sideways. As lagging indicators, they confirm what prices have already done rather than predict future moves, which creates both their primary value and their core limitation. This article explains how different moving average types work, what their signals actually mean, and when they produce reliable results versus false signals. Whether you’re new to technical analysis or refining your interpretation skills, understanding these time-tested tools provides essential context for reading market momentum across any timeframe.
How Moving Averages Smooth Price Data
Moving averages transform chaotic price fluctuations into a single, continuously updated line that reveals the underlying direction of market movement. This smoothing effect works by calculating the average closing price over a specified number of periods—whether that’s 10 hours on an intraday chart or 200 days on a daily timeframe.
The calculation mechanism is straightforward. A 20-period moving average adds the closing prices of the last 20 candles, divides by 20, then repeats this process as each new candle forms. As the newest price enters the calculation and the oldest drops out, the average shifts, creating a flowing line that filters out the random noise inherent in raw price action.
This filtering comes with an important limitation: moving averages are lagging indicators. They reflect what prices have already done, not what they will do next. A 50-day moving average tells you where the average price stood over the past 50 days, providing confirmation of trends rather than prediction of future moves. This lag increases with longer periods—a 200-day moving average responds much more slowly to price changes than a 10-day average.
Traders adjust timeframes based on their strategy and trading horizon. Day traders might use 9-period and 21-period averages on 5-minute charts to capture short-term momentum. Swing traders often reference 20-day and 50-day averages to identify intermediate trends. Position traders and institutional investors watch the 50-day and 200-day moving averages, which have served as benchmark trend indicators for over seven decades.
The choice of period length creates a tradeoff: shorter periods react faster but generate more false signals, while longer periods provide more reliable trend confirmation but respond sluggishly to genuine reversals.
Types of Moving Averages: SMA, EMA, and WMA
The calculation method behind a moving average determines how quickly it responds to price changes. Three primary types dominate forex trading, each with distinct mathematical approaches that create measurably different signals in live markets.
Simple Moving Average (SMA)
The SMA calculates the arithmetic mean of prices over a specified period, giving equal weight to every data point. A 20-day SMA adds the closing prices of the past 20 days and divides by 20. This equal weighting creates a smooth line that’s less reactive to sudden price spikes, making it valuable for identifying established trends. The trade-off: the SMA lags significantly during volatile market conditions, often signaling trend changes well after they’ve begun.
Exponential Moving Average (EMA)
The EMA applies a multiplier that gives progressively more weight to recent prices. A 20-day EMA might weight today’s price at 9.5% while the oldest price receives less than 0.1% influence. This exponential weighting makes the EMA react approximately 20-30% faster than an equivalent-period SMA. Day traders and scalpers favor the EMA because it reduces lag during fast-moving sessions, though this responsiveness also generates more false signals in choppy markets.
Weighted Moving Average (WMA)
The WMA uses linearly decreasing weights rather than exponential ones. In a 10-day WMA, day 10 receives 10 units of weight, day 9 receives 9 units, down to day 1 with 1 unit. This creates a middle ground between SMA smoothness and EMA responsiveness.
| Moving Average Type | Weighting Method | Responsiveness | Best For |
|---|---|---|---|
| SMA | Equal across all periods | Slowest | Swing trading, long-term trends |
| EMA | Exponentially weighted toward recent prices | Fastest (20-30% quicker than SMA) | Day trading, scalping |
| WMA | Linearly decreasing weights | Moderate | Position trading, medium-term analysis |
Most institutional traders monitor both SMA and EMA on the same chart to distinguish between confirmed trends (SMA) and early momentum shifts (EMA).
Key Moving Average Periods and What They Reveal
Selecting the right moving average period determines whether you’re tracking daily noise or multi-month trends. The timeframe you choose should align with your trading style and the market patterns you want to capture.
Short-Term Moving Averages
Day traders and scalpers rely on faster moving averages to identify immediate price momentum:
- 10-period MA: Captures very short-term trends, ideal for scalping on 5-minute or 15-minute charts
- 20-period MA: Popular among active traders for identifying intraday reversals and momentum shifts
- 20-period EMA on 4-hour charts: Widely used by forex swing traders to filter out market noise while staying responsive to price changes
These shorter periods react quickly to price movements but generate more false signals during choppy markets. The exponential version (EMA) is particularly favored for short-term analysis because it prioritizes recent price action over older data.
Long-Term Moving Averages
Institutional investors and position traders focus on slower moving averages that reveal broader market direction:
- 50-day MA: Tracks intermediate trends and serves as a key support/resistance level watched by professional traders
- 200-day MA: The most referenced long-term indicator, used continuously for over 70 years to identify major market trends
The 200-day moving average holds particular significance. When price trades above this level, markets are generally considered bullish; below it signals bearish conditions. Major crossovers involving the 200-day MA often attract substantial trading volume as institutional algorithms react to these signals.
Different trading styles demand different periods. A forex scalper monitoring EUR/USD on 1-minute charts might use a 9-period EMA, while a retirement fund manager tracking equity indices relies on the 200-day SMA. Neither approach is superior—they serve distinct purposes across separate timeframes.
Reading Trend Direction and Strength
The slope and direction of a moving average provide an immediate visual assessment of market momentum. When a moving average angles upward, it confirms an uptrend is in progress. A downward-sloping MA signals a downtrend. The steeper the angle, the stronger the underlying momentum driving price action.
Moving Average Slope
Slope steepness reveals whether traders are aggressively pushing prices or merely maintaining modest directional bias. A 50-day MA climbing at a sharp angle suggests strong buying pressure, while a gently rising MA indicates a weak or mature trend that may be losing steam. Conversely, a flat moving average indicates consolidation—price is oscillating within a range without establishing clear directional bias. This often occurs during market indecision or when significant support and resistance levels contain price movement.
Price Position Relative to Moving Averages
Where price sits in relation to the moving average matters considerably. Price trading above its MA suggests bullish conditions, with the moving average potentially acting as dynamic support during pullbacks. Price below the MA indicates bearish conditions, with the moving average serving as overhead resistance.
Multiple moving averages of different periods create a ribbon effect that reveals trend layers. When a 20-day MA sits above a 50-day MA, which sits above a 200-day MA, all sloping upward, the alignment confirms a strong, multi-timeframe uptrend. Ribbon compression—when multiple MAs converge—warns of weakening momentum or an impending trend change. Traders monitor these relationships to gauge whether current trends have room to extend or are nearing exhaustion.
Moving Average Crossovers: Golden Cross and Death Cross
When a 50-day moving average crosses above the 200-day moving average, traders worldwide take notice. This pattern, known as a golden cross, has preceded significant bull markets throughout financial history and remains one of the most widely tracked technical signals in forex and equity markets.
A golden cross occurs when a shorter-term moving average crosses above a longer-term moving average, signaling potential bullish momentum. The most common pairing uses the 50-day and 200-day moving averages, though forex traders frequently apply this concept to hourly or 4-hour charts using 20-period and 50-period moving averages for shorter-term opportunities.
The death cross represents the inverse scenario. When the short-term moving average crosses below the long-term moving average, it suggests weakening momentum and potential bearish conditions ahead. These crossovers don’t predict market direction with certainty—they confirm trend changes that have already begun to unfold, since moving averages are lagging indicators by design.
Crossover strategies rank among the most popular trading approaches precisely because they provide clear, objective signals. A trader either has a crossover or doesn’t. This binary simplicity appeals to both algorithmic systems and discretionary traders seeking systematic entry and exit rules.
The MACD (Moving Average Convergence Divergence) indicator builds directly on this crossover concept, measuring the relationship between two exponential moving averages and generating buy or sell signals when they converge or diverge.
Research indicates that simple crossover strategies achieve win rates around 40-50%, which might seem discouraging until you consider risk-reward dynamics. A strategy that wins 45% of the time but captures larger gains on winning trades while limiting losses on losing trades can deliver consistent profitability. Trending markets provide the ideal environment for crossover strategies, while choppy, range-bound conditions tend to generate false signals and whipsaws that erode trading capital.
Moving Averages as Dynamic Support and Resistance
Price rarely moves in a straight line, even in strong trends. Moving averages create flexible boundaries that travel with price action, offering traders visual reference points that static horizontal lines cannot provide. Unlike fixed support and resistance zones drawn from historical swing points, these dynamic levels adjust continuously as new price data emerges.
Support in Uptrends
In established uptrends, moving averages frequently act as support zones where price retraces before resuming its upward trajectory. The 20-day and 50-day moving averages are particularly effective for this purpose in forex markets. When EUR/USD rallies from 1.0500 to 1.1000, for example, the 50-day MA might rise from 1.0600 to 1.0800 during the same period. Pullbacks often find buyers near this rising average, creating multiple bounce opportunities. Traders watch for price to approach the MA, observe candlestick patterns or momentum shifts, then enter long positions anticipating the support will hold. The stronger the trend, the more reliable this support becomes.
Resistance in Downtrends
The inverse relationship applies during downtrends. Moving averages cap rallies as price struggles to break above these descending levels. A currency pair in a downtrend might repeatedly fail at its 50-day MA, with each rejection confirming the bearish bias. Short-sellers use these zones to enter positions or add to existing trades.
Multiple moving averages create support or resistance zones rather than single lines. When the 20-day, 50-day, and 100-day MAs cluster together, this confluence strengthens the technical significance. Price breaking through such a zone signals potential trend exhaustion. This dynamic framework works best in clear trending conditions; choppy, sideways markets produce frequent false signals as price whipsaws through moving averages without respecting them as boundaries.
When Moving Averages Work Best (and When They Don’t)
Moving averages deliver their most reliable signals during sustained trends but can bleed trading accounts during sideways price action. Understanding this fundamental distinction separates profitable traders from those who blindly follow crossover signals.
Ideal Market Conditions
Strong directional markets create the environment where moving averages shine. When EUR/USD trends upward for weeks or months, a 50-day moving average provides a clear dynamic support level that traders can use for entry points. The lagging nature of moving averages becomes an advantage here—the smoothed price data confirms the trend rather than reacting to every minor fluctuation.
Moving averages work particularly well in these scenarios:
- Strong trending markets with clear higher highs and higher lows (or lower lows and lower highs)
- Post-breakout environments where price establishes a new directional bias
- Markets with consistent momentum lasting multiple weeks or months
- Higher timeframes (daily, weekly) where noise is naturally filtered out
Approximately 60-70% of professional forex traders incorporate moving averages into their analysis toolkit, though rarely as standalone indicators.
Limitations and False Signals
Ranging markets produce whipsaws—false signals where moving average crossovers suggest trend changes that never materialize. When GBP/JPY trades between 180.00 and 182.00 for three weeks, moving averages generate multiple buy and sell signals as price oscillates above and below the indicator line. Each signal appears valid but leads to small losses as price reverses.
The core limitation stems from moving averages being lagging indicators. They reflect what price has already done, not where it’s heading. During choppy conditions, this lag creates signals after the move has exhausted itself.
Successful traders combine moving averages with momentum oscillators like RSI or volume analysis to filter false signals. A moving average crossover gains credibility when accompanied by expanding volume and confirming momentum readings. Context matters more than the indicator itself.
Practical Applications for Forex Traders
Successfully integrating moving averages into your forex trading workflow requires a systematic approach that balances responsiveness with reliability. Start by adding the 20-day, 50-day, and 200-day moving averages to your charts—these periods align with institutional trading desks and create a shared reference point across the market. When major currency pairs like EUR/USD bounce off the 200-day moving average, the reaction often intensifies because thousands of traders are watching the same level.
Selecting the right moving average type matters for execution quality. EMAs respond faster to price changes, making them suitable for day traders and swing traders who need timely entry signals. SMAs filter out more noise and work better for position traders focused on multi-week trends. A trader scalping GBP/JPY on 15-minute charts might use a 9-period EMA, while a position trader holding USD/CAD for months would reference the 200-day SMA.
Follow this implementation sequence to build a complete system:
- Establish the primary trend using the 200-day moving average—trade long above it, short below it, or avoid the pair during choppy consolidation
- Add a secondary moving average (50-day or 20-day) to identify pullback opportunities within the established trend
- Confirm signals with price action by watching for candlestick patterns, support/resistance breaks, or momentum divergences near moving average levels
- Layer in volume indicators or RSI to validate the strength behind moving average crossovers before committing capital
- Adjust periods for your timeframe—shorter periods (10, 20) for intraday charts, longer periods (100, 200) for daily and weekly analysis
Moving averages function as dynamic support and resistance zones rather than exact price levels. Price often approaches these lines multiple times before breaking through. Set stop-losses beyond the moving average with room for normal volatility—typically 10-20 pips for major pairs on daily charts.
Risk management supersedes any technical signal. Moving average crossovers produce false signals in ranging markets, and lagging indicators cannot predict sudden news events or central bank interventions. Position sizing and maximum drawdown limits protect your account when the technical setup fails.
Moving averages have served as foundational technical tools for over 70 years, used by the majority of professional traders to identify trends and filter market noise. Their enduring popularity stems from simplicity and objectivity, not predictive accuracy. As lagging indicators, they confirm what prices have already done rather than forecast future moves, which means their effectiveness depends entirely on market conditions. They excel during sustained trends but generate costly false signals during range-bound consolidation. The 200-day moving average remains particularly significant because institutional algorithms and discretionary traders worldwide reference this same benchmark, creating self-reinforcing support and resistance reactions. Moving averages work best as part of a broader analytical framework that includes price action, volume analysis, and momentum indicators. No single indicator—moving averages included—can replace sound risk management, proper position sizing, and realistic expectations about win rates and drawdowns. Use them to confirm directional bias and identify potential entry zones, but never as standalone signals that override fundamental market context or risk controls.