Candlestick charts are the primary charting method for approximately 90% of forex traders, serving as the visual foundation for technical analysis across all major trading platforms. These distinctive price bars originated in 18th century Japan with rice trader Homma Munehisa, who developed a method to capture market psychology through four data points—open, high, low, and close. Today, candlestick patterns dominate modern trading because they convey more information in a single glance than any other charting method. This guide teaches you how to read candlestick anatomy, recognize the most reliable patterns, and apply this knowledge to forex trading. Whether you’re opening your first demo account or refining your chart reading skills, understanding candlesticks is essential for interpreting price action and making informed trading decisions.
What Are Candlestick Charts and Why Do Traders Use Them?

The Historical Origins of Candlestick Charts
Candlestick charts trace their roots to 18th century Japan, where rice trader Homma Munehisa developed this visual method to track price movements in the Osaka rice markets. His technique captured four critical data points—open, high, low, and close (OHLC)—within a single graphical element, creating a more intuitive representation of market sentiment than simple line charts. This innovation remained largely confined to Japanese markets for over two centuries until technical analyst Steve Nison introduced candlestick charting to Western traders through his 1991 book “Japanese Candlestick Charting Techniques.”
Each candlestick displays a complete picture of price action during a specific timeframe. The rectangular body represents the range between opening and closing prices, while the thin lines extending above and below—called wicks or shadows—show the highest and lowest prices reached during that period. Green or white candlesticks indicate bullish movement where the closing price exceeded the opening price, while red or black candlesticks signal bearish periods where prices declined.
Why Candlesticks Dominate Modern Forex Trading
Approximately 90% of forex traders now use candlestick charts as their primary charting method, making them the de facto standard across major trading platforms including MetaTrader 4/5, TradingView, and cTrader. This widespread adoption stems from their superior information density—a single candlestick conveys market psychology, momentum, and price extremes that would require multiple indicators on a line chart.
Traders can identify over 40 recognized candlestick patterns, ranging from single-candle formations like doji and hammer to complex triple-candle patterns such as morning stars and three white soldiers. These patterns serve as visual shorthand for market behavior, helping traders spot potential reversals, continuations, and indecision points. While pattern reliability varies—with predictive accuracy typically ranging from 50-70% depending on market conditions—their universal recognition creates self-fulfilling prophecies as thousands of traders react to the same signals simultaneously.
Anatomy of a Candlestick: Understanding OHLC Data
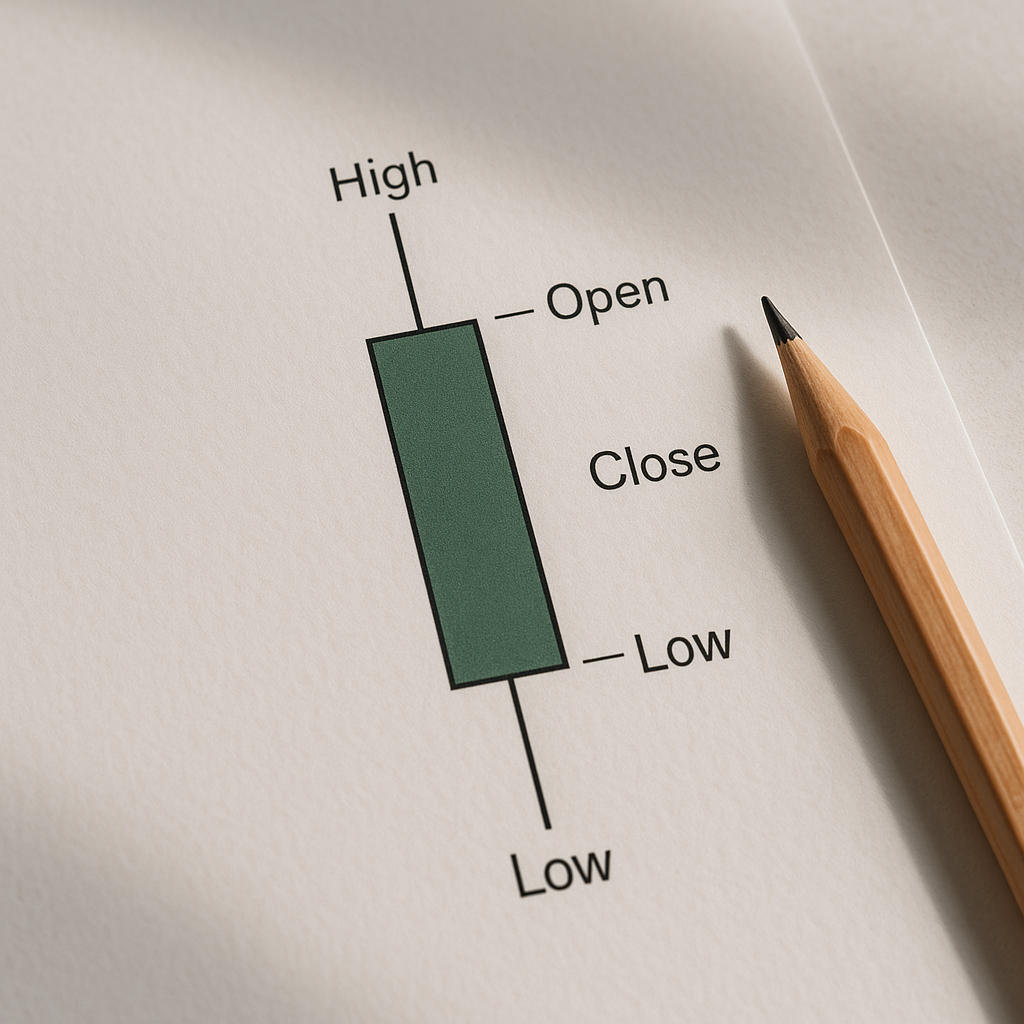
Every candlestick on your chart contains four distinct price points that tell the story of market action during a specific time period. These data points—open, high, low, and close (OHLC)—form the foundation of price action analysis and appear in every candlestick regardless of your timeframe.
The Candlestick Body and What It Reveals
The rectangular body represents the battle between buyers and sellers, showing the distance between the opening and closing prices. A green or white body indicates a bullish period where the close exceeded the open, signaling buying pressure dominated. Conversely, a red or black body reveals a bearish period with the close below the open, demonstrating seller control.
Body size matters significantly. A long body suggests strong conviction in the price direction, with one side clearly overpowering the other. A short or nearly nonexistent body (called a doji) indicates indecision, where neither buyers nor sellers gained meaningful ground despite potential price movement during the period.
Wicks and Shadows: Reading Price Extremes
The thin lines extending above and below the body—called wicks, shadows, or tails—reveal the complete price range tested during that period:
- Upper wick: Shows the highest price reached before sellers pushed it back down
- Lower wick: Displays the lowest price reached before buyers stepped in
- Long upper wick: Suggests rejection of higher prices and potential selling pressure
- Long lower wick: Indicates buyers defended lower levels and absorbed selling
A candlestick with no wicks means the open or close matched the period’s high or low, signaling strong directional momentum. When analyzing forex pairs like EUR/USD, these wicks often reveal where institutional orders sit, as price repeatedly tests then retreats from specific levels. Understanding this rejection behavior helps traders identify support and resistance zones that matter in real-time market conditions.
Candlestick Timeframes: From Scalping to Long-Term Analysis
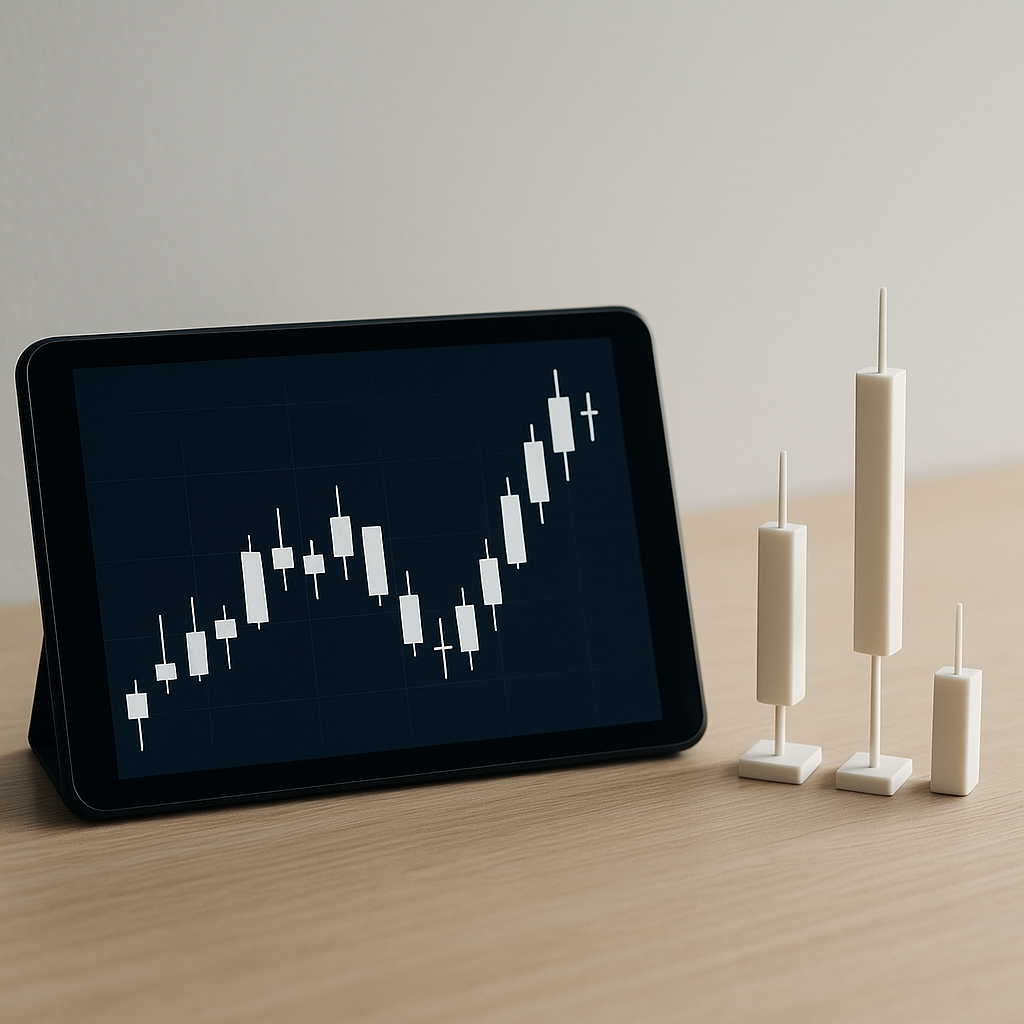
Timeframe selection fundamentally alters how candlestick patterns should be interpreted and acted upon. A 1-minute candlestick represents just 60 seconds of price movement, while a monthly candlestick captures an entire month’s trading activity. Each timeframe serves different trading approaches and reveals different market dynamics.
Scalpers operating on 1-minute or 5-minute charts see dozens of candlestick patterns daily. These ultra-short timeframes generate frequent signals but carry higher noise levels and false signals. A doji on a 1-minute chart might simply reflect momentary indecision during a consolidation, while the same pattern on a daily chart signals genuine market uncertainty affecting longer-term trends.
Day traders typically focus on 15-minute to 4-hour charts, balancing pattern frequency with reliability. Swing traders analyze daily and 4-hour charts to capture multi-day price movements. Position traders and investors rely primarily on daily, weekly, and monthly charts where patterns have greater statistical significance and filtering out market noise becomes easier.
| Timeframe | Trading Style | Typical Hold Period | Pattern Reliability | Signals Per Day |
|---|---|---|---|---|
| 1-5 minutes | Scalping | Seconds to minutes | Low (high noise) | 50-200+ |
| 15min-1 hour | Day Trading | Minutes to hours | Medium | 10-30 |
| 4-hour-Daily | Swing Trading | Days to weeks | High | 1-5 |
| Weekly-Monthly | Position Trading | Weeks to months | Very High | <1 |
The same engulfing pattern carries different weight across timeframes. A bullish engulfing on a 5-minute chart might reverse a minor pullback. On a weekly chart, it could signal a major trend reversal affecting positions held for months. Understanding this context prevents misapplying short-term signals to long-term positions and vice versa.
Common Single Candlestick Patterns Every Trader Should Know
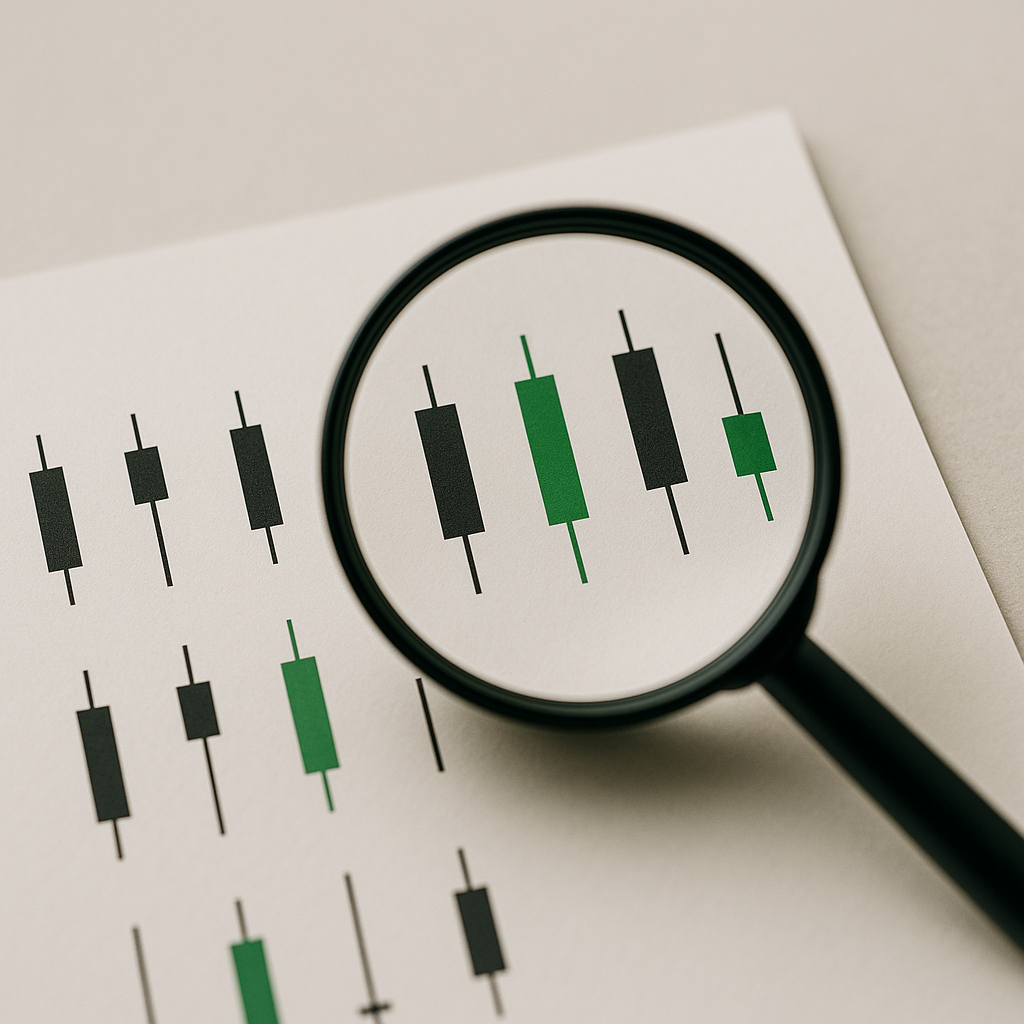
Single candlestick patterns form the foundation of price action analysis, offering immediate insights into market psychology. These formations appear within a single trading period and can signal potential reversals or continuation moves when interpreted correctly.
The Doji: Recognizing Market Indecision
A doji forms when opening and closing prices are virtually identical, creating a candlestick with little to no body and wicks extending from a central point. This pattern reveals equilibrium between buyers and sellers, with neither side gaining control during the session. Dojis become particularly significant when they appear after extended trends, suggesting the prevailing momentum may be exhausting.
Four main doji variations exist: the standard doji with equal-length wicks, the long-legged doji with extended shadows showing extreme volatility, the dragonfly doji with a long lower wick indicating bullish rejection, and the gravestone doji with a long upper wick signaling bearish rejection. The context surrounding a doji determines its reliability. A doji appearing at support or resistance levels carries more weight than one forming mid-trend.
Hammer and Hanging Man: Context Matters
The hammer and hanging man share identical physical characteristics—a small body at the upper end of the trading range with a lower wick at least twice the body length. The critical difference lies in where they appear. A hammer forms at the bottom of a downtrend, suggesting buyers stepped in to reject lower prices and potentially reverse the decline. The long lower wick demonstrates that sellers pushed prices down during the session, but buyers regained control before the close.
Conversely, a hanging man appears at the top of an uptrend with the same structure. Despite the bullish close, the extended lower wick reveals that sellers tested lower prices, hinting at weakening buyer conviction. Both patterns require confirmation from subsequent price action. A hammer followed by a bullish candlestick strengthens the reversal signal, while a hanging man confirmed by bearish follow-through validates the potential top.
Body size relative to wick length reveals pressure intensity. A hammer with a tiny body and extended lower wick shows strong rejection of lower prices, while a larger body indicates less decisive buyer control.
Multi-Candlestick Patterns: Engulfing, Morning Star, and Evening Star
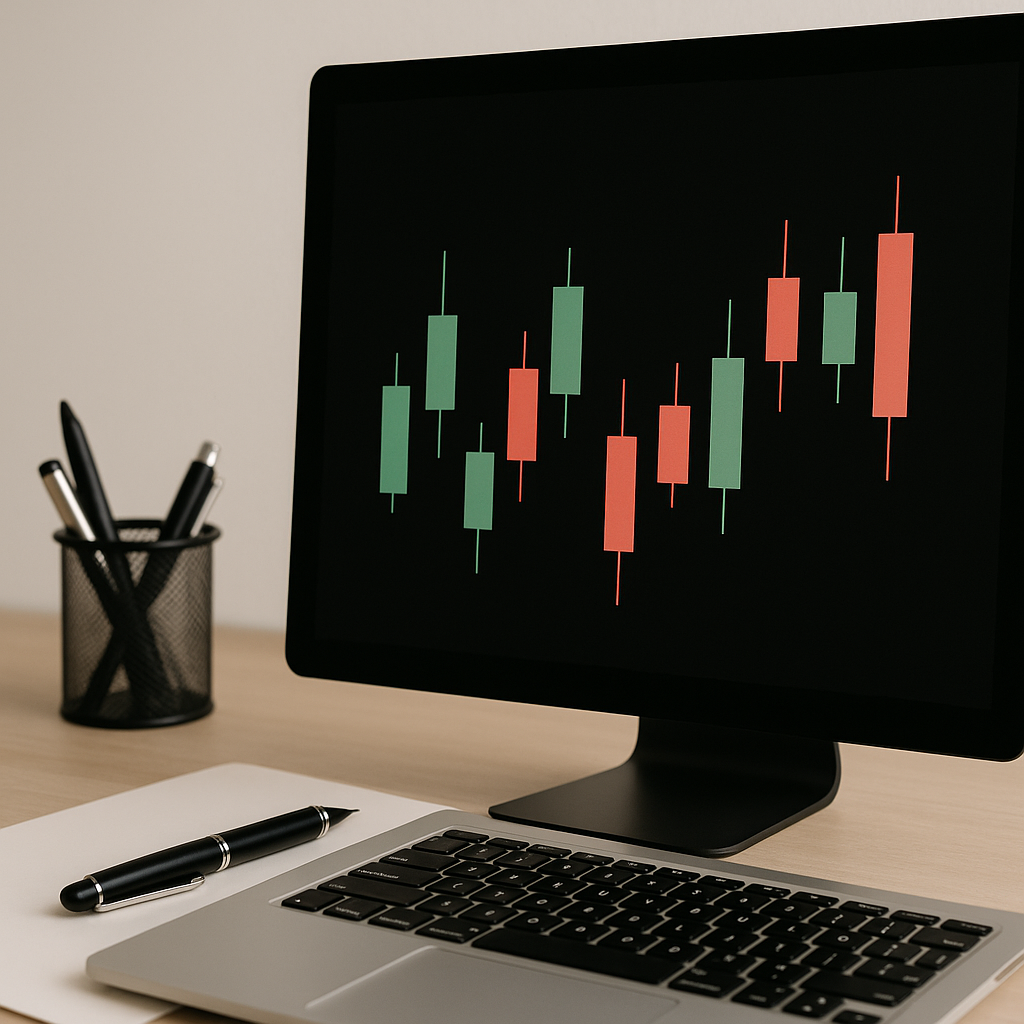
Multi-candlestick patterns combine two or more consecutive candles to signal potential trend reversals with greater reliability than single-candle formations. Among the more than 40 recognized candlestick patterns, these multi-candle setups provide traders with higher-probability trading opportunities when identified correctly.
Bullish and Bearish Engulfing Patterns
The engulfing pattern stands out as one of the most dependable reversal signals in forex markets, with accuracy rates between 60-63% depending on market conditions. A bullish engulfing occurs when a large green candle completely engulfs the previous red candle’s body, signaling strong buying pressure. The pattern’s success rate increases to 63% when accompanied by above-average volume confirmation.
Bearish engulfing patterns work inversely—a large red candle completely covers the prior green candle’s body, indicating sellers have overwhelmed buyers. The key requirement: the second candle’s body must fully encompass the first candle’s body from open to close, though wicks can extend beyond.
Critical identification factors:
- The pattern appears after a clear uptrend (bearish) or downtrend (bullish)
- The engulfing candle’s body completely covers the previous candle’s body
- Larger size difference between candles increases pattern reliability
- Volume confirmation strengthens the reversal signal
Star Patterns: Morning and Evening Reversals
Morning star and evening star patterns are triple-candle formations that signal major trend reversals. The morning star appears at downtrend bottoms, consisting of a long bearish candle, followed by a small-bodied candle (the “star”) that gaps down, and finally a strong bullish candle closing well into the first candle’s body.
Evening stars mirror this structure at uptrend peaks. The star candle can be bullish, bearish, or a doji—its small body relative to surrounding candles matters most. These patterns require patience as they develop over three trading periods, but their completion often marks significant turning points in price action.
The Reality of Candlestick Pattern Accuracy
Candlestick patterns typically deliver predictive accuracy between 50-70%, depending on the specific formation and prevailing market conditions. This means that even the most reliable patterns fail roughly one-third to one-half of the time. The bullish engulfing pattern, considered among the more dependable formations, achieves approximately 63% success in forex markets when confirmed with volume analysis.
These success rates reveal an uncomfortable truth: no candlestick pattern guarantees profitable trades. A doji appearing at market highs might signal reversal, or it could simply represent temporary indecision before continuation. The same hammer pattern that works brilliantly during a strong uptrend may fail completely in choppy, directionless markets.
Context determines everything. A morning star pattern carries more weight when it forms at a major support level with oversold momentum indicators than when it appears randomly mid-trend. Market volatility, liquidity conditions, and broader trend direction all influence whether a pattern will play out as expected. High-impact news releases can invalidate even textbook-perfect formations within seconds.
Confirmation separates disciplined traders from gamblers. Rather than entering trades immediately upon pattern recognition, experienced traders wait for additional evidence. This might include a breakout beyond the pattern’s high or low, volume spikes confirming institutional interest, or alignment with moving averages and oscillators like RSI or MACD.
The most effective approach combines candlestick patterns with complementary technical tools. A shooting star becomes significantly more actionable when it coincides with resistance levels, bearish divergence on momentum indicators, and declining volume on rallies. Standalone pattern trading resembles navigating with only partial information. Integration with support/resistance zones, trend analysis, and volume indicators transforms candlestick patterns from unreliable signals into components of a robust trading methodology.
Combining Candlestick Analysis with Other Technical Indicators

Over 75% of professional traders combine candlestick analysis with at least two other indicators—and for good reason. Candlestick patterns alone provide limited context about market conditions, often leading to false signals and premature entries. The most effective approach integrates multiple confirmation tools to validate what candlesticks suggest.
Volume: Confirming Pattern Validity
Volume serves as the foundation for confirming candlestick patterns. A bullish engulfing pattern with high volume carries significantly more weight than the same pattern on light trading activity. When a hammer candlestick forms at support with volume spiking above the 20-day average, the reversal signal gains credibility.
Consider this practical example: A morning star pattern appears after a downtrend. Without volume analysis, you might enter immediately. However, if the third candle shows declining volume, the pattern’s reliability drops substantially. Strong volume on the reversal candle confirms genuine buying pressure rather than temporary price fluctuation.
Key volume confirmations to watch:
- Bullish patterns should show increasing volume on up candles
- Bearish patterns gain strength when down candles display higher volume
- Breakout patterns require volume at least 50% above average to validate the move
- Declining volume during pattern formation often signals weak conviction
Trend Indicators and Support/Resistance
Moving averages provide essential trend context that candlesticks cannot offer alone. A doji candlestick means little without knowing whether price sits above or below the 50-day moving average. The same pattern signals indecision in an uptrend but potential reversal at resistance.
Support and resistance levels validate pattern significance. A shooting star candlestick at a major resistance level carries far more weight than one forming mid-range. Combine these elements systematically: identify the trend with moving averages, locate key support/resistance zones, then wait for candlestick confirmation with volume backing before executing trades. This layered approach significantly improves pattern reliability beyond the 50-70% baseline accuracy of standalone candlestick signals.
Practical Tips for Reading Candlestick Charts in Forex Trading
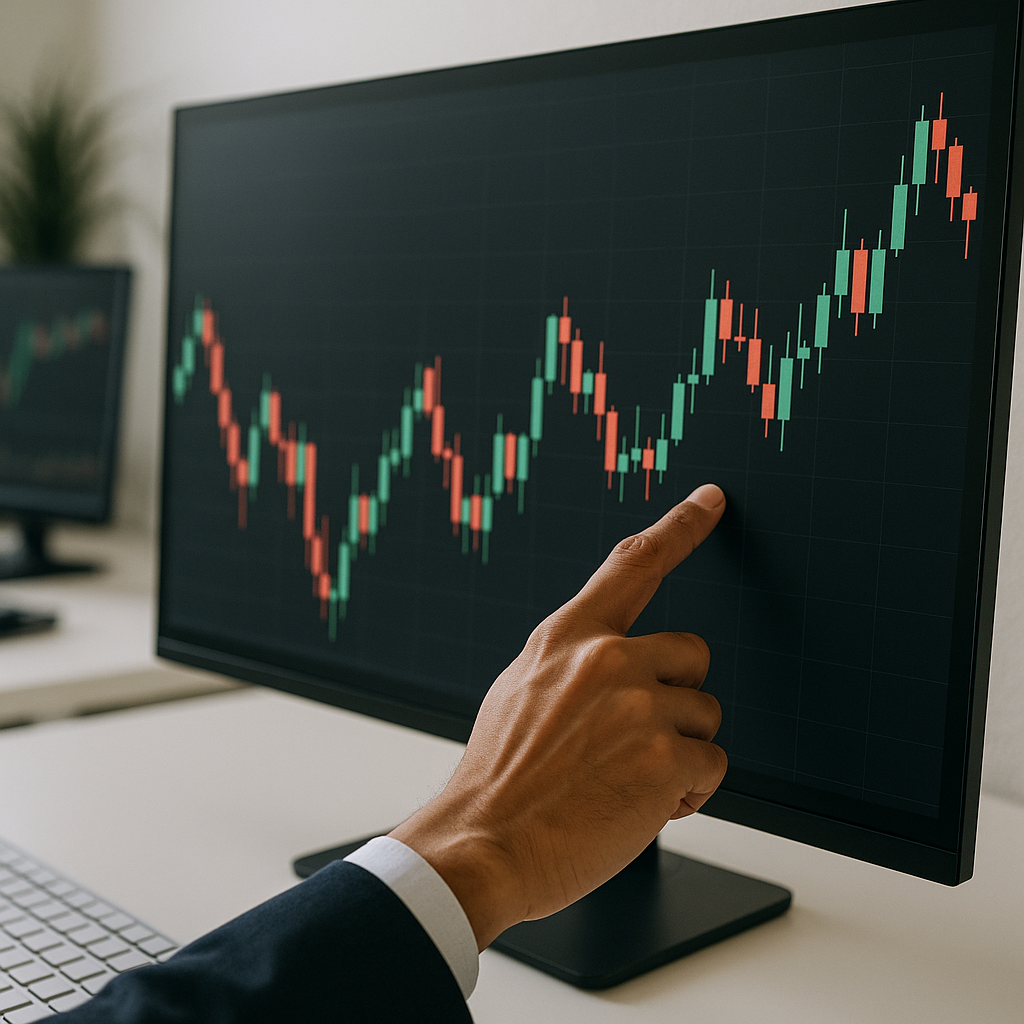
Beginners often make the mistake of jumping directly into live trading after learning just a few candlestick patterns. This approach typically leads to losses and frustration. A structured learning process significantly improves pattern recognition skills and trade execution.
Start with a demo account for at least 60 days. This risk-free environment allows you to identify patterns in real-time without financial pressure. Track your pattern recognition accuracy by documenting each setup you identify and whether the expected price movement actually occurred. Many traders discover their initial pattern identification accuracy hovers around 40-50% before improving with practice.
Master 5-10 core patterns before expanding your knowledge. Focus initially on high-probability formations like the bullish engulfing, bearish engulfing, hammer, shooting star, and doji. Studies indicate these fundamental patterns show predictive accuracy between 50-70% in forex markets when properly confirmed. Learning too many patterns simultaneously creates confusion and reduces your ability to spot quality setups.
Context matters more than the pattern itself. A bullish hammer appearing during a strong downtrend carries far more weight than the same pattern forming in choppy, sideways price action. Always identify the broader trend using higher timeframes before analyzing individual candlestick formations. A pattern aligned with the dominant trend typically offers better risk-reward ratios.
Wait for confirmation candles before entering trades. False signals and market noise are prevalent in forex markets, particularly during low-liquidity sessions. The next candlestick after a pattern should confirm the expected direction. For example, after spotting a morning star reversal pattern, wait for a subsequent bullish candle that closes above the pattern’s high before entering long positions.
Common pitfalls to avoid:
- Trading patterns in isolation without volume or momentum confirmation
- Ignoring key support and resistance levels where patterns form
- Using candlestick signals on excessively short timeframes (under 15 minutes) where noise dominates
- Forcing pattern recognition when price action doesn’t clearly match textbook examples
Remember that no pattern guarantees profits. Even high-probability setups fail, making proper risk management essential for long-term success.
Building Your Candlestick Reading Skills

Candlestick charts are essential tools for forex traders, but mastering them requires practice, patience, and proper context. While patterns like engulfing formations and morning stars offer valuable insights into market psychology, they deliver predictive accuracy between 50-70%—not certainties. This reality underscores why successful traders combine candlestick analysis with volume confirmation, support/resistance levels, and momentum indicators rather than relying on patterns alone.
Start your learning journey with 5-10 fundamental patterns and practice identifying them on a demo account for at least 60 days. Track your accuracy, document your observations, and gradually build expertise before risking real capital. Focus on higher timeframes initially—daily and 4-hour charts offer more reliable signals with less noise than 1-minute or 5-minute charts where false patterns proliferate.
Remember that context determines pattern significance. A hammer at major support during an uptrend carries far more weight than the same formation appearing mid-range in choppy markets. Always wait for confirmation candles and volume backing before executing trades based on candlestick signals.
Most importantly, implement strict risk management on every trade. Even textbook-perfect patterns fail, and no amount of technical analysis eliminates market risk. Position sizing, stop-loss placement, and disciplined trade management matter more than pattern recognition alone. Candlestick charts provide a powerful framework for reading price action, but continuous learning, realistic expectations, and proper risk controls separate consistently profitable traders from those who struggle. Treat pattern mastery as a long-term skill development process rather than a shortcut to guaranteed profits.